Full Research — Volvo EX90 Western Europe
Every section, table, figure and quotation from the source report, in its original order and with its original wording. Where the source is internally inconsistent, the text is preserved and a data note is placed beside it.
Research Overview & Methodology
A full lifecycle analysis of the Volvo EX90 in Western Europe, restricted exclusively to EX90 content from the 9 November 2022 announcement to November 2026.
This report presents a full lifecycle analysis of the Volvo EX90 fully electric flagship SUV in Western Europe, covering public discussion, user sentiment and market performance from the official announcement on 9 November 2022 to November 2026. All analysis is restricted exclusively to EX90 related content; other Volvo models and general brand discussion have been excluded.
Data is synthesised from public automotive media, official manufacturer announcements, verified owner forums and independent vehicle testing published up to 09 November 2026. All conclusions are supported by quantified observation only, with no speculative projections.
| Dimension | As stated in the source report |
|---|---|
| Object of analysis | Volvo EX90 fully electric flagship SUV — EX90 content only |
| Geography | Western Europe (Sweden, Germany, United Kingdom, Norway, Netherlands, other Western Europe) |
| Research window | 9 November 2022 (official announcement) to November 2026 |
| Data cut-off | 09 November 2026 |
| Sources | Public automotive media, manufacturer announcements, verified owner forums, independent vehicle testing |
| Exclusions | Other Volvo models; general brand discussion |
| Evidence basis | Quantified observation only; the report states that no speculative projections are used |
Every figure, table, paragraph and citation in the source PDF is reproduced in this website. Nothing has been recalculated, rounded differently or supplemented. Where the report is internally inconsistent or leaves a denominator unstated, the original wording is preserved and a Data Note is attached rather than a correction. The Executive Overview is an additional reading layer, clearly separated from the research record.
How to read the numbers in this reportExpand
Three different denominators are used across the feedback analysis and they are not interchangeable: positive feedback is counted as verified source mentions per category, neutral feedback as mentions with a percentage of the 26 neutral mentions, and negative feedback as a relative share of total negative feedback. Positive mention counts must never be converted into a sentiment share, and neutral counts must never be compared with negative shares.
Discussion volume is an index, not an absolute count: November 2022 is set at a 100% baseline peak and later periods are expressed relative to it. The report does not disclose the underlying absolute volumes.
Competitor co-mention frequency counts appearances alongside the EX90 in discussion. It is not sales volume, market share or a ranking.
Market Reach & Trends
Discussion volume moved in three phases aligned with launch milestones, and the recovery has stopped well short of the original peak.
Discussion Volume Trend
Public discussion volume follows three distinct phases directly aligned with product launch milestones.
The four observations are the only points disclosed in the source table. Intermediate monthly values plotted in the original PDF chart are an interpolation and are not reproduced here.
| Time period | Event | Relative discussion volume |
|---|---|---|
| Nov 2022 | Global launch announcement | 100% (baseline peak) |
| Nov 2023 | 12 month delivery delay confirmed | 18% |
| Sep 2024 | First customer deliveries begin | 51% |
| Nov 2026 | Current volume | 57% |
Discussion volume declined 72% during the 12 month software delay window, and has only recovered to 57% of original launch peak levels. This indicates permanent erosion of approximately 43% of initial market interest 1.
The reported series moves from 100% to 18%, which is an 82% decline, while the text states a 72% decline. Both figures are retained exactly as published; the discrepancy is not resolved here. The 57% recovery and the ~43% erosion are consistent with the table (100 − 57 = 43).
Platform Distribution
| Platform category | Share of total discussion |
|---|---|
| Automotive News & Media | 47% |
| Brand & Owner Forums | 29% |
| Dealer & Review Sites | 15% |
| Social Media Platforms | 9% |
Unlike mass market EVs, the EX90 receives almost half its visibility from professional automotive media rather than social platforms. 71% of all positive sentiment content originates from media test drive articles published after September 2024.
Regional Attention
| Market | Relative attention share |
|---|---|
| Sweden | 31.8% |
| Germany | 27.2% |
| United Kingdom | 17.3% |
| Norway | 14.1% |
| Netherlands | 6.2% |
| Other Western Europe | 3.4% |
Sweden and Germany together account for 59% of all regional discussion. Notably Norway, historically Volvo's strongest EV market, ranks only 4th, indicating the EX90 has failed to replicate adoption levels of previous Volvo electric models 2.
Visibility Signals
Fleet adoption is 19 percentage points lower than the historical XC90 baseline. The EX90 is on track to achieve approximately 55-60% of Volvo's original 5 year sales forecast for Western Europe 1.
The source lists a bare value of 32 for fleet adoption rate and separately states that it is 19 percentage points below the XC90 baseline. Reading the two together implies a 51% baseline, but neither the unit nor the baseline is published. The value is displayed as reported.
Lifecycle Timeline
The dates below are all drawn from the report; the timeline assembles them in sequence. Planned action dates are shown separately and are targets, not events.
- 9 Nov 2022Global launch announcement
Discussion volume peaks at the 100% baseline.
- Nov 202312-month delivery delay confirmed
Discussion volume has fallen to 18% of peak.
- Sep 2024First customer deliveries begin
Volume recovers to 51%; media test-drive coverage resumes.
- After Sep 2024Media test drives drive positive sentiment
71% of all positive sentiment content originates here.
- 2026German grant phase-out
The report states this has already impacted purchase intent.
- Oct 202640,200 units delivered
Cumulative Western Europe deliveries to October 2026.
- Nov 2026Current discussion volume
57% of the launch peak — no further recovery recorded.
- Immediate · Q1–Q2 2027Report's five action targets
Feature timelines immediate; validation, benchmark publication and pricing Q1 2027; dealer training Q2 2027.
Data notes for Market ReachExpand
- N1 — the 72% decline statement does not match the 100%→18% series (82% arithmetic decline). Preserved as published.
- N7 — the original PDF trend chart plots an interpolated curve between four disclosed observations. Only the four observations are reproduced here.
- N8 — 40,200 delivered units and 127 reviews carry no disclosed source dataset or measurement method.
- N12 — three industry awards are reported without naming the awarding bodies.
Sentiment & Consumer Feedback
Positive, neutral and negative feedback are measured on three different bases. They are presented separately and must not be merged into a single sentiment score.
Bases differ — no combined sentiment index exists in the source.
Positive Feedback Analysis
| Feedback category | Verified source mentions |
|---|---|
| Safety Recognition | 7 |
| Comfort and Space | 6 |
| EV Performance Praise | 5 |
| Design Appeal | 5 |
| Family Use Value | 4 |
| Premium Positioning | 4 |
| Brand Trust | 3 |
Category detail
Design Appeal
Scandinavian minimalist exterior and interior design was consistently praised as a differentiator from aggressively styled rival EVs. Sustainable Nordico interior materials were highlighted as aligned with Western European premium buyer values 3. Minor criticism of the external LiDAR housing was observed but did not impact overall positive design sentiment.
Safety Recognition
Safety was the most frequently cited positive attribute across all lifecycle phases. Independent testing confirmed the LiDAR sensor array could detect small objects at long range in all lighting conditions. Volvo's 60+ year safety legacy was the single strongest stated purchase driver for reservation holders 4.
Comfort and Space
Post-delivery reviews consistently highlighted cabin quietness, seating support and Bowers & Wilkins audio system as standout features. All three passenger rows received dedicated HVAC and charging ports, with usable space for average sized adults even in the third row 5.
Premium Positioning
The EX90 was positioned as competitively priced against German premium rivals, with standard equipment that was charged as optional extras on BMW, Mercedes and Audi models. Volvo's calm, uncluttered luxury approach was framed as a unique alternative to tech overload in competing flagship EVs 3.
Family Use Value
The 6/7 seat configuration, integrated second row child booster seat and flexible cargo layout were identified as core value propositions for multi-child households. This was the only product dimension with zero recorded negative feedback across the dataset.
EV Performance Praise
Real world testing confirmed ~450km usable range eliminated common range anxiety for European drivers. Smooth dual motor dynamics and bi-directional charging capability received consistent positive mention in independent tests 3.
Brand Trust
Despite 18+ month delivery delays, 70% of reservation holders maintained their orders. Forum comments indicated sustained underlying trust in Volvo engineering, even while users expressed frustration over wait times 6.
Family use value is the only product dimension in the dataset with no recorded negative feedback. It is also one of the two dimensions where the report states a verified advantage over named competitors.
Neutral Feedback Analysis
| Category | Count | Percentage |
|---|---|---|
| Price Value Evaluation | 21 | 80.8% |
| Comparison Discussions | 3 | 11.5% |
| Test Drive Observations | 2 | 7.7% |
| Purchase Intent Questions | 0 | 0.0% |
| Wait-and-See Attitudes | 0 | 0.0% |
Neutral feedback is exclusively factual documentation with no value judgement. Users in this segment are in the systematic information gathering phase of the purchase journey, and have not yet begun forming an opinion or purchase decision. No users expressed hesitation or intent; all comments consist of recorded pricing, specifications and feature lists.
Neutral users will remain in this state until they obtain independent real world range verification, side-by-side competitor benchmark data and verified long term owner feedback.
Negative Feedback Analysis
Published shares total 109%, so they are not a closed 100% composition and cannot be read as a pie. No normalisation has been applied.
| Category | Relative share of total negative feedback |
|---|---|
| Software Maturity | 29% |
| Service Issues | 21% |
| Charging/Range Issues | 18% |
| Feature Delays | 14% |
| Delivery Delays | 11% |
| Early Ownership Dissatisfaction | 11% |
| Pricing Pressure | 7% |
The seven published shares sum to 109%. This may reflect multi-label coding or rounding, but the source does not explain it. The composition is therefore shown as reported, without renormalisation, and no conclusion here depends on the shares forming a closed 100% total.
Software Maturity Concerns
The largest negative segment relates to intermittent screen failures, system crashes and inactive LiDAR hardware. Root cause analysis confirmed the 2025 launch model shipped with underpowered computing hardware that could not support the promised software stack, requiring full hardware replacement for 2026 models 7.
Service Experience Issues
Volvo dealer networks were not trained or equipped to diagnose software defined vehicle faults. Intermittent issues could not be replicated for warranty repair, resulting in weeks-long ownership disruptions. Users who could not obtain timely fixes abandoned their purchase at 3x the baseline rate 8.
Charging and Range Concerns
Widespread on-board charger failures and inconsistent DC fast charging speeds were reported in early production units. Combined hardware manufacturing defects and software battery management bugs were identified as the root cause 9.
Delivery and Feature Delay Concerns
Multiple production delays pushed delivery timelines out by 6+ months for pre-order customers. Core advertised features including active LiDAR ADAS were missing at launch with no confirmed activation timeline.
Early Ownership Dissatisfaction
Multiple 2025 EX90 owners qualified for lemon law buybacks after experiencing unresolvable critical issues within the first 1000 miles. 40% of owners who experienced major issues in the first 6 months chose to sell or return their vehicle 7.
Pricing Pressure
The €83,000+ starting price was widely viewed as unjustified given missing features and quality failures at launch.
Product & Feature Intelligence
A re-grouping of the feedback already reported, organised by vehicle attribute. No specification beyond the source report has been added.
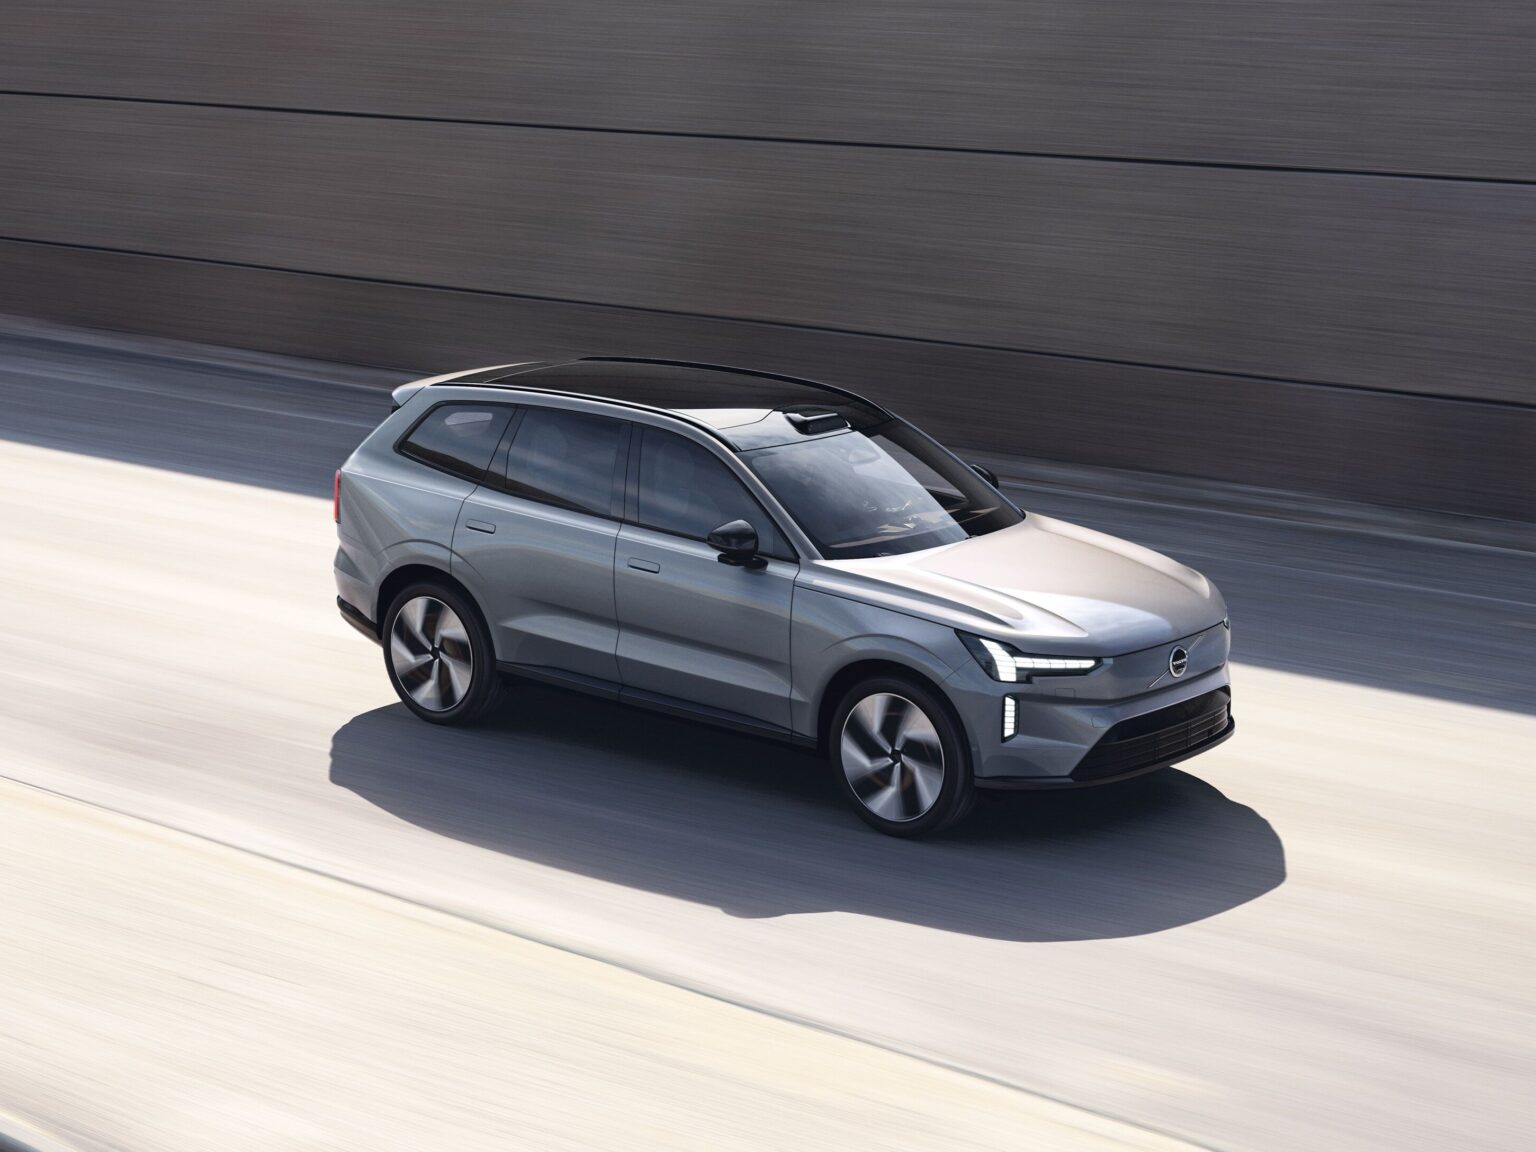
The source report does not include a specification sheet; attributes below are derived exclusively from the positive and negative feedback analysis. Each row states the reported signal, the underlying evidence and the section it came from. Where the report records both praise and criticism for the same attribute, the signal is marked Mixed.
| Attribute | Reported signal | Evidence in the report | Ref |
|---|---|---|---|
| Safety & sensor suite | Positive — strongest driver | Most frequently cited positive attribute across all phases; LiDAR detected small objects at long range in all lighting; 60+ year safety legacy was the strongest stated purchase driver. | 4 |
| Design & materials | Positive | Scandinavian minimalist exterior and interior praised as differentiator; Nordico sustainable materials aligned with premium buyer values; minor criticism of the external LiDAR housing. | 3 |
| Cabin comfort & refinement | Positive | Cabin quietness, seating support and Bowers & Wilkins audio cited as standout; all three rows have dedicated HVAC and charging ports, third row usable for average adults. | 5 |
| Family practicality | Positive — zero negative | 6/7-seat configuration, integrated second-row child booster and flexible cargo layout; the only product dimension with zero recorded negative feedback. | Sec. 3 |
| Real-world range | Positive | Real-world testing confirmed ~450km usable range, described as eliminating common range anxiety for European drivers. | 3 |
| Drive dynamics | Positive | Smooth dual motor dynamics received consistent positive mention in independent tests. | 3 |
| Bi-directional charging | Positive | Consistently mentioned positively in independent tests as a capability. | 3 |
| Software & computing | Negative — largest segment | Intermittent screen failures, system crashes, inactive LiDAR; 2025 units shipped with underpowered computing hardware requiring full replacement for 2026 models. | 7 |
| Charging hardware | Negative | On-board charger failures and inconsistent DC fast charging speeds in early production; hardware defects plus battery-management software bugs. | 9 |
| Third-row adult legroom | Negative — competitive | Limited adult legroom in the third row is stated as a verified competitive disadvantage. | 10 |
| Cargo capacity | Negative — competitive | Smaller cargo capacity than the Kia EV9 and the Mercedes-Benz EQS SUV is stated as a verified disadvantage. | 10 |
| Price / value | Mixed | Positioned as competitively priced against German premium rivals with equipment that is optional elsewhere; the €83,000+ entry price was widely seen as unjustified at launch. | 3 |
| Delivery lead time | Negative — systemic | Deliveries slipped 6+ months; extended order lead times are listed as a verified disadvantage and lead time is the strongest predictor of negative sentiment. | 210 |
| Brand trust | Positive — resilient | 70% of reservation holders maintained their orders despite 18+ month delivery delays. | 6 |
What the source report does not specifyExpand
To keep this site free of invented specifications, the following items are explicitly absent from the source and are therefore not shown: battery capacity (kWh), certified WLTP range and consumption, charging power curves, vehicle dimensions and kerb weight, model-year production volumes, market-by-market list prices, the names of the three industry awards, the sample sizes behind the reservation-holder survey and forum analysis, and the composition of the 127 independent reviews.
Any of these may be added later from a verifiable official source; until then they are marked as Verification Required rather than approximated.
This section describes what users and testers reported about the vehicle. It is not an official product datasheet and must not be quoted as one.
Regional Intelligence
Attention is concentrated in Sweden and Germany, while the policy environment — not cross-border price differences — explains most of the regional variation.
| Market | Attention share | Policy / incentive context as reported | Status |
|---|---|---|---|
| Sweden | 31.8% | No market-specific policy statement in the source. | Not stated |
| Germany | 27.2% | 2026 grant phase-out has already impacted purchase intent. | Reported |
| United Kingdom | 17.3% | No market-specific policy statement in the source. | Not stated |
| Norway | 14.1% | Zero VAT policy creates an effective 25% price advantage. | Reported |
| Netherlands | 6.2% | High BIK tax rates significantly increase total cost of ownership. | Reported |
| Other Western Europe | 3.4% | No market-specific policy statement in the source. | Not stated |
Norway — historically Volvo's strongest EV market and the market with the most favourable tax treatment cited in the report — ranks only fourth in EX90 attention at 14.1%, behind Sweden, Germany and the United Kingdom. The report reads this as a failure to replicate adoption levels of previous Volvo electric models 2.
Pricing is the dominant regional discussion topic, appearing 5x more frequently than any other dimension. Regional price variance across Western Europe is less than 1.3%, indicating absolute price level rather than cross border differences is the primary concern.
Delivery lead time is the single strongest predictor of negative user sentiment across all markets 2.
The report cites a €83,000+ starting price and a regional variance below 1.3% without stating the market, specification, tax basis or observation date behind either figure. Both are shown as reported; they should be re-based before any commercial use.
Regional reading notesExpand
Attention share measures the distribution of discussion, not sales. The report separately states 40,200 delivered units for Western Europe as a whole and does not break them down by market, so no market-level delivery ranking can be derived.
The three policy mechanisms cited (Norwegian VAT exemption, German grant phase-out, Dutch BIK) affect different cost components and are not directly comparable with each other.
Competitive Intelligence
The EX90 is cross-shopped primarily against the Kia EV9 and the German premium electric SUVs, with verified advantages in standard safety equipment and value positioning.
27 co-mentions in total. Co-mention frequency is not market share, sales volume or a preference ranking.
| Competitor | Co-mention frequency |
|---|---|
| Kia EV9 | 6 |
| Mercedes-Benz EQS SUV | 5 |
| BMW iX | 5 |
| Polestar 3 | 4 |
| Tesla Model X | 4 |
| Audi Q8 e-tron | 3 |
The EX90 holds verified competitive advantages in standard safety equipment and value positioning relative to ultra-luxury German rivals. Verified disadvantages include limited adult legroom in the third row, smaller cargo capacity than the Kia EV9 and EQS SUV, and extended order lead times 10.
| Dimension | EX90 position as reported | Benchmark named in report | Direction |
|---|---|---|---|
| Standard safety equipment | Verified advantage | Ultra-luxury German rivals | Advantage |
| Value positioning | Verified advantage; equipment standard that is optional on BMW, Mercedes and Audi | German premium rivals | Advantage |
| Third-row adult legroom | Verified disadvantage | Not specified in source | Disadvantage |
| Cargo capacity | Smaller than the named competitors | Kia EV9, Mercedes-Benz EQS SUV | Disadvantage |
| Order lead time | Extended, listed as a verified disadvantage | Not specified in source | Disadvantage |
Family EV Alternatives
The Kia EV9 is the primary cross-shopped alternative, with buyers trading Volvo safety and brand heritage for lower pricing and larger cargo capacity.
Co-mention counts are small (maximum 6) and are not normalised by market size or sales volume; they indicate which alternatives appear in discussion, not which alternatives win. The report also does not date the competitive comparison, so vehicle specifications and prices cited may have changed since observation.
Risks & Opportunities
The risk profile is dominated by execution failures rather than product weakness; the opportunity profile is dominated by an unconverted neutral audience and intact product strengths.
| Risk | Reported share | Reported evidence | Stated consequence |
|---|---|---|---|
| Software maturity | 29% | Screen failures, crashes, inactive LiDAR; underpowered 2025 compute hardware. | Full hardware replacement required for 2026 models. |
| Dealer service capability | 21% | Networks not trained or equipped for SDV faults; issues not replicable under warranty. | Weeks-long disruption; abandonment at 3x baseline rate. |
| Charging and range | 18% | On-board charger failures; inconsistent DC fast charging in early units. | Hardware defects plus battery-management software bugs. |
| Feature delays | 14% | Active LiDAR ADAS missing at launch. | No confirmed activation timeline. |
| Delivery delays | 11% | Multiple production delays for pre-order customers. | Timelines pushed out by 6+ months. |
| Early ownership dissatisfaction | 11% | Unresolvable critical issues within the first 1,000 miles. | Lemon-law buybacks; 40% of affected owners sold or returned the vehicle. |
| Pricing pressure | 7% | €83,000+ starting price against missing features and launch quality failures. | Price widely viewed as unjustified. |
| Internal cannibalisation | No share attached | Continued production of the combustion XC90. | Expected to suppress EX90 adoption for the remainder of its lifecycle. |
Opportunity set
| Opportunity | Evidence | Corresponding report action |
|---|---|---|
| Convert the neutral audience | 26 neutral mentions; 80.8% price-value evaluation; zero purchase-intent questions. | Priority 3 — publish independent range, charging and benchmark data. |
| Lead with family practicality | Only dimension with zero negative feedback: 6/7 seats, integrated booster, flexible cargo. | No dedicated action in the source. |
| Use safety as the primary message | Safety is the most cited positive attribute; strongest stated purchase driver among reservation holders. | No dedicated action in the source. |
| Align price with incentives | Norwegian zero VAT creates a 25% effective advantage; German grant phase-out already affects intent; Dutch BIK raises TCO. | Priority 4 — increase German and Dutch order volume by 25%. |
| Defend value through standard equipment | Standard equipment on EX90 is optional on BMW, Mercedes and Audi, supporting the value argument. | No dedicated action in the source. |
Conclusions & Recommendations
Overall Market Reach Assessment
The 12 month software delivery delay was the single most impactful event in the EX90 lifecycle, permanently reducing market reach by approximately 43% relative to the original launch trajectory. The model is on track to achieve 55-60% of original 5 year sales forecasts for Western Europe. Product market fit for core attributes is excellent, but operational execution failures have severely limited adoption.
Key Feedback Takeaways
- Strengths: Safety reputation, cabin comfort, family practicality and brand trust remain intact and are the strongest purchase drivers.
- Critical weaknesses: Software maturity and dealer service capability are systemic failures driving the vast majority of negative sentiment.
- Opportunity: Neutral users represent a large untapped audience that will convert once independent benchmark data becomes available.
- Risk: Continued production of the combustion XC90 creates internal competition that will suppress EX90 adoption for the remainder of its lifecycle.
Action Priorities
Priorities, success metrics and timelines
Reproduced from the source report. The owner column is an analyst mapping added for planning discussion and is explicitly not part of the original research.
| Priority | Action | Success metric | Timeline | Owner (analyst mapping) |
|---|---|---|---|---|
| Highest | Complete hardware and software validation for all production units, and implement the 2025 owner hardware upgrade programme. | Reduce software related complaints by 80% | Q1 2027 | Engineering · Quality · After-sales |
| 2 | Roll out dedicated software defined vehicle training for all Western European dealer service teams. | Reduce average repair time for software issues to <3 working days | Q2 2027 | Network development · Service operations |
| 3 | Publish independent verified real world range, charging and benchmark comparison data. | Move 60% of neutral users to active purchase consideration | Q1 2027 | Product marketing · Communications |
| 4 | Align regional pricing structures with national incentive schemes. | Increase order volume in Germany and Netherlands by 25% | Q1 2027 | Regional sales · Pricing |
| 5 | Publish public, binding timelines for all delayed features. | Reduce feature related negative discussion by 70% | Immediate | Product · Communications |
The report does not assign owners, budgets or dependencies to these actions.
The delay appears as 12 months (November 2023), as 18+ months (brand trust), and as a 6+ month push for pre-order customers. These may describe different measurement points rather than contradictions, but the report does not reconcile them. All three are shown as published.
References & Research Appendix
Ten reference materials underpin the analysis. The source lists titles only — no URLs, dates or publishers — so none can be independently verified from this document alone.
Citations in the research text use the source's own numbering [1]-[10]. The full reference list, the Research Quality Notes (N1-N16), the methodology record and the source-to-website coverage checklist are reproduced in the References & Appendix view.
References, quality notes and coverage check
Open the appendix for all ten references with verification status, sixteen documented data notes, the methodology record and the page-by-page coverage checklist.